

What you can do
Use Langdock for data analysis when you want to:- Read tabular data from CSV, Excel, and Google Sheets files
- Calculate metrics, correlations, distributions, and deviations
- Compare segments, columns, regions, time periods, or categories
- Create charts and visualizations from data
- Generate files such as Excel, CSV, Word, PDF, JSON, and text files
Analyze a spreadsheet
1
Add your data
Upload a CSV or Excel file, connect a Google Sheet, or select a spreadsheet from your integrations. You can attach several spreadsheets in the same message and ask Langdock to merge them, compare them, or mark the differences.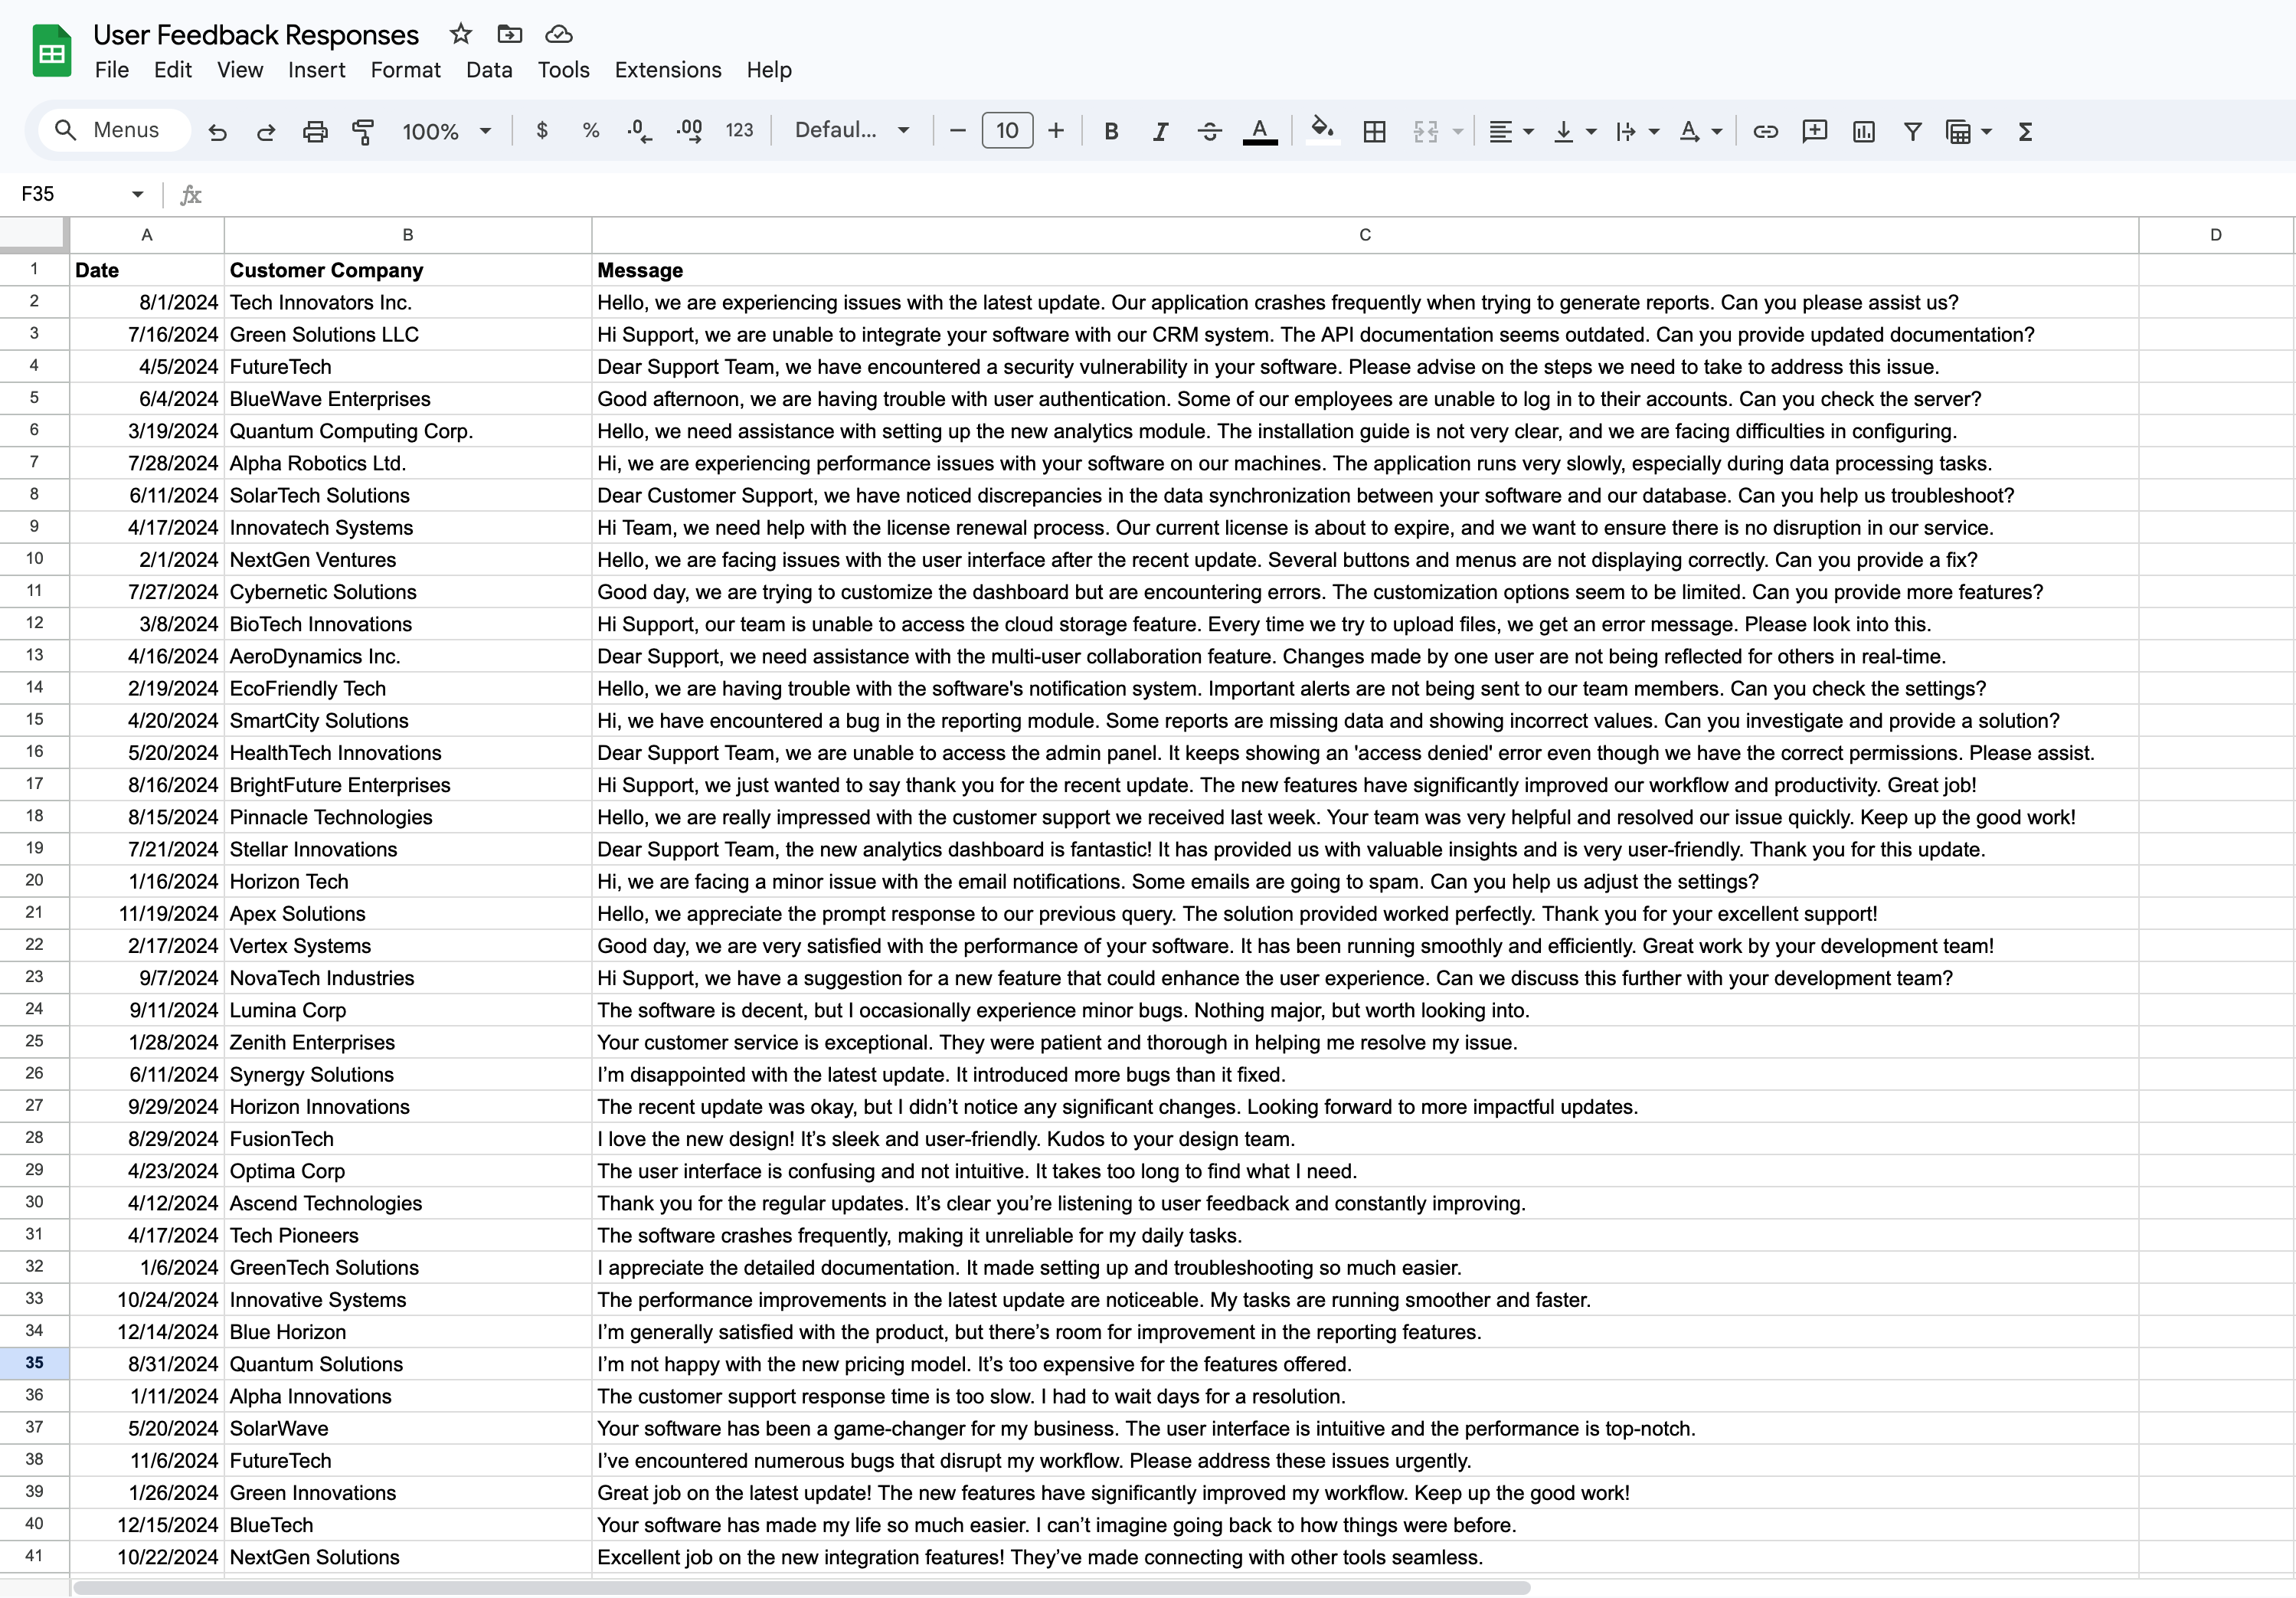
2
Ask a specific question
Describe the metric, grouping, time period, and output format you need. For example, ask Langdock to summarize trends, calculate totals, compare columns, or create a chart.
3
Review the result
Check whether the answer uses the right columns, filters, and assumptions. Check the figures against the source. If anything is missing, ask a follow up question with the exact correction.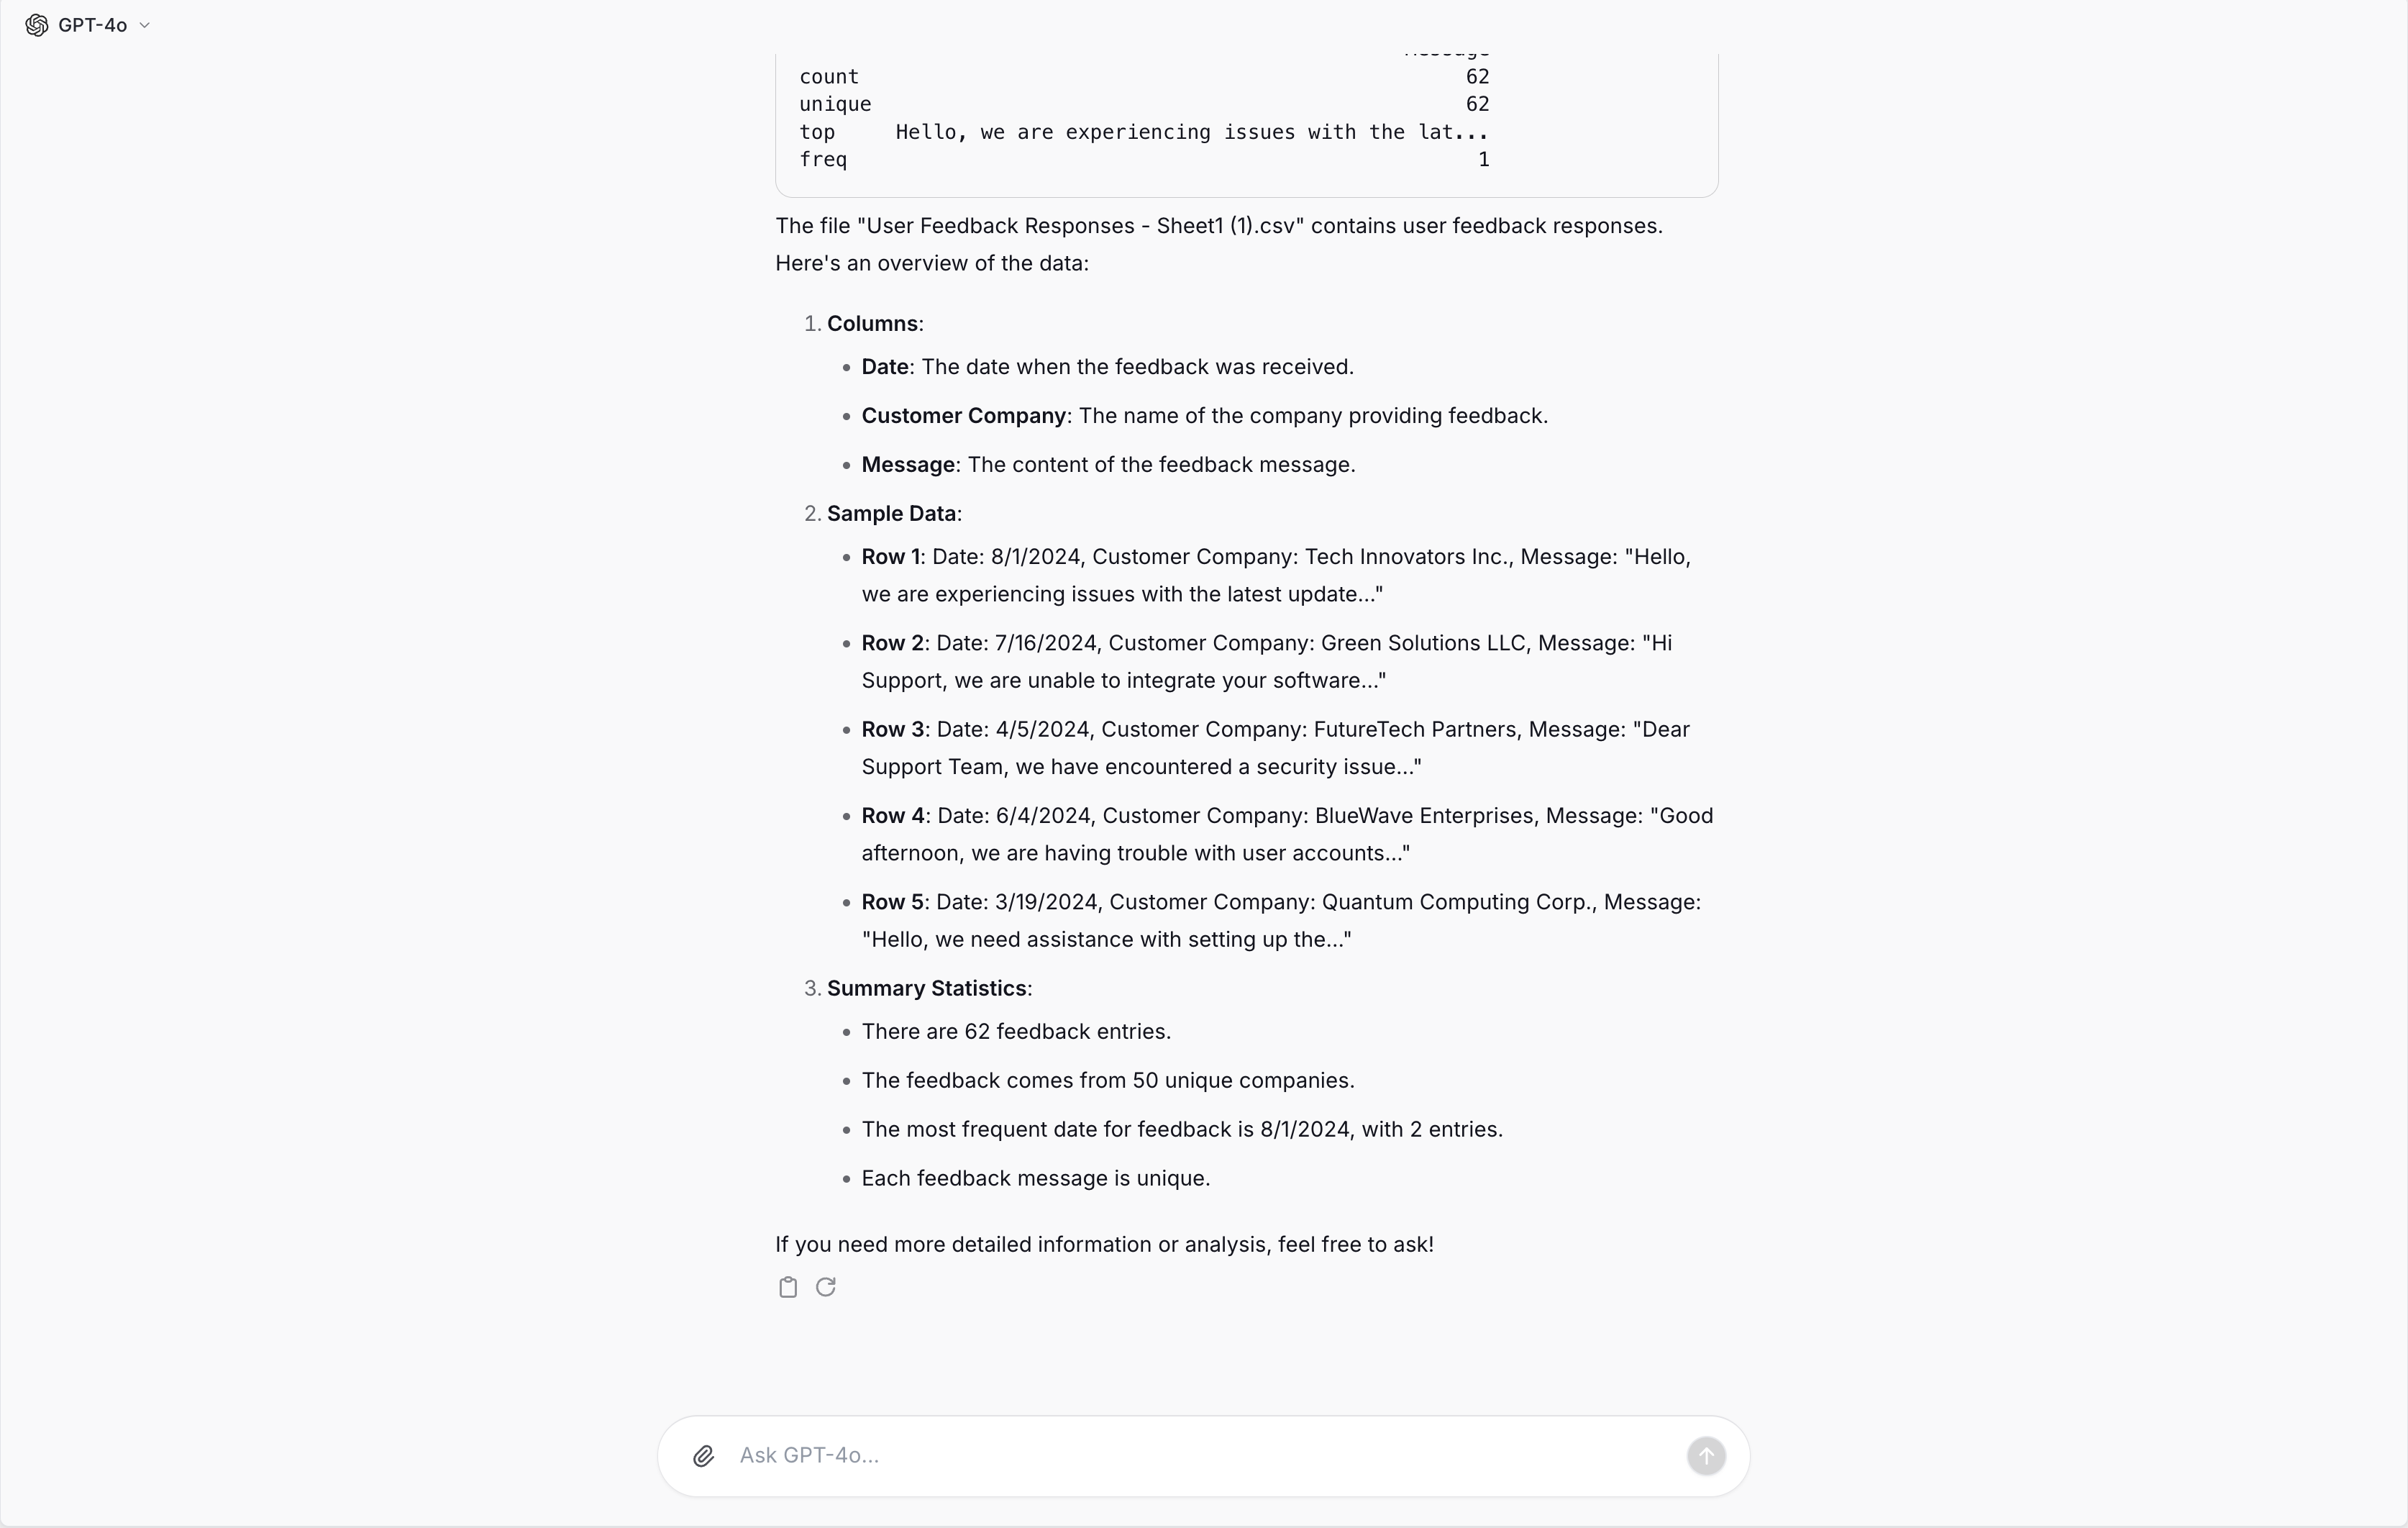
4
Generate an output file
Ask Langdock to export the result as a spreadsheet, document, PDF, JSON file, or chart image.
Example prompts
Use specific prompts that name the data, calculation, and expected output:- “Analyze monthly sales trends over the last 12 months and identify seasonal patterns”
- “Calculate the average deal size by region and return the result as a table”
- “Find the top 5 products by revenue and create a bar chart”
- “Compare churn rate by customer segment and explain the largest differences”
- “Create an Excel file with one sheet per region”
Statistical analysis examples
Langdock can help with common statistical tasks on tabular data:Output formats
Langdock can return analysis results in several formats:
In the Excel add-in, replies cite workbook cells as clickable pills that open the referenced sheet and select the range, so you can check every result against the underlying data.
Data analysis vs document search
Use data analysis for structured rows and columns. It works best for calculations, comparisons, transformations, charts, and generated spreadsheet files. Use document search for prose documents, contracts, reports, and files where you need text extraction or source based answers.Your Agents can analyze tabular data and create files when your workspace has Allow create & work with files enabled. If you can’t analyze tabular data or create files, contact your workspace admin.
Best practices
- Use descriptive column names. Refer to the full column title instead of labels like “Column K”.
- Keep column titles in the first row whenever possible.
- Avoid empty cells when you can.
- Include the metric, grouping, time period, and preferred output format in your prompt.
- Break complex analysis into multiple prompts when the first result is incomplete or incorrect.